| Full Year ended Sept. 30 (billions) | FY 2012 | FY 2011 |
|---|---|---|
| Revenue | $65.2 | 65.7 |
| Expenses* | 67.5 | 68.4 |
| Separation Costs | 0.1 | - |
| Operating Income (Loss)* | (2.4) | (2.7) |
| Retiree Health Benefits Pre-Funding** | (11.1) | - |
| Workers' Comp. Fair Value Adj. | (0.4) | (1.0) |
| Workers' Comp. Other Non Cash Adj. | (2.0) | (1.4) |
| Net Income (Loss) | ($15.9) | ($5.1) |
| Volume (Pieces) | 159.9 | 168.3 |
| * Before RHB pre-funding and non-cash adjustments to workers compensation liabilities. * * 2011 RHB pre-funding was deferred to 2012. |
||
| Full Year ended Sept. 30 (billions) | FY 2012 | FY 2011 |
|---|---|---|
| Revenue | $65.2 | 65.7 |
| Expenses* | 67.5 | 68.4 |
| Separation Costs | 0.1 | - |
| Operating Income (Loss)* | (2.4) | (2.7) |
| Retiree Health Benefits Pre-Funding** | (11.1) | - |
| Workers' Comp. Fair Value Adj. | (0.4) | (1.0) |
| Workers' Comp. Other Non Cash Adj. | (2.0) | (1.4) |
| Net Income (Loss) | ($15.9) | ($5.1) |
| Volume (Pieces) | 159.9 | 168.3 |
| * Before RHB pre-funding and non-cash adjustments to workers’ compensation liabilities. * * 2011 RHB pre-funding was deferred to 2012. |
||
Source: Christensen Associates
| Full Year ended Sept. 30 (billions) | FY 2012 | FY 2011 |
|---|---|---|
| Revenue | $65.2 | 65.7 |
| Expenses* | 67.5 | 68.4 |
| Separation Costs | 0.1 | - |
| Operating Income (Loss)* | (2.4) | (2.7) |
| Retiree Health Benefits Pre-Funding** | (11.1) | - |
| Workers' Comp. Fair Value Adj. | (0.4) | (1.0) |
| Workers' Comp. Other Non Cash Adj. | (2.0) | (1.4) |
| Net Income (Loss) | ($15.9) | ($5.1) |
| Volume (Pieces) | 159.9 | 168.3 |
| * Before RHB pre-funding and non-cash adjustments to workers’ compensation liabilities. * * 2011 RHB pre-funding was deferred to 2012. |
||
November 15, 2012
| $ in billions | FY 2012 Actual | FY 2013 IFP |
|---|---|---|
| Revenue | $65.2 | 64.9 |
| Expenses* | 67.5 | 66.7 |
| Separation Costs | 0.1 | 0.2 |
| Operating Income (Loss)* | $ (2.4) | $ (2.0) |
| RHB Pre-funding (Current Law) | (11.1) | (5.6) |
| Non-cash adjustments to workers' comp | (2.4) | TBD |
| Net Income (Loss) | $ (15.9) | $ (7.6) |
| Volume (B pieces) | 160 | 153 |
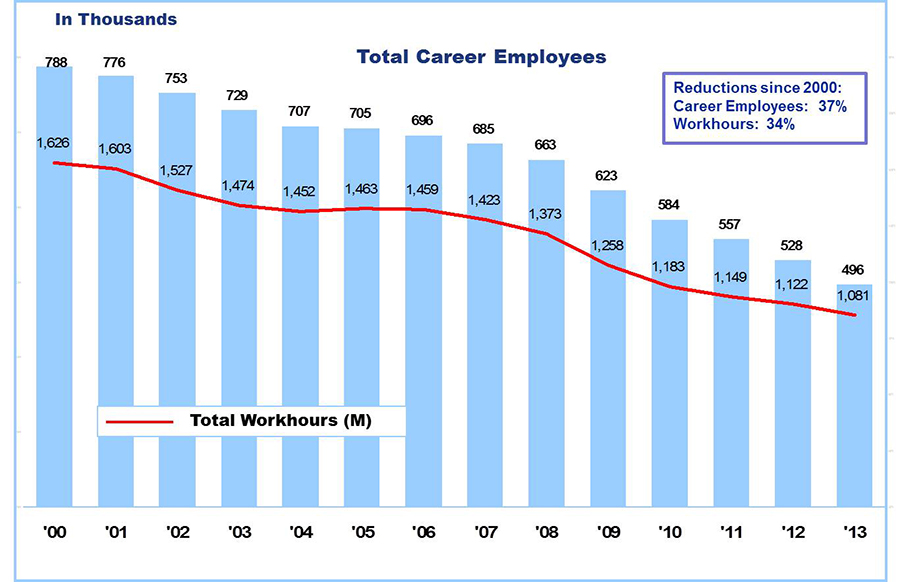
| Attrition ('000 people) | 29 | 32 |
| Workhour Reduction (M) | 27 | 41 |
* Excludes non-cash adjustments to workers’ compensation liabilities. |
||
| $ in billions | FY 2012 Actual | FY 2013 IFP |
|---|---|---|
| Revenue | $65.2 | 64.9 |
| Expenses* | 67.5 | 66.7 |
| Separation Costs | 0.1 | 0.2 |
| Operating Income (Loss)* | $ (2.4) | $ (2.0) |
| RHB Pre-funding (Current Law) | (11.1) | (5.6) |
| Non-cash adjustments to workers' comp | (2.4) | TBD |
| Net Income (Loss) | $ (15.9) | $ (7.6) |
| Volume (B pieces) | 160 | 153 |
| Attrition ('000 people) | 29 | 32 |
| Workhour Reduction (M) | 27 | 41 |
* Excludes non-cash adjustments to workers’ compensation liabilities. |
||
| Capital Commitments | ||||
|---|---|---|---|---|
| in Billions | 5-Year Avg. (2006 - 2010) |
FY 2011 Actual |
FY 2012 Actual |
FY 2013 IFP |
| Facilities | $ 0.9 | $ 0.9 | $ 0.3 | $ 0.4 |
| Equipment | 0.5 | 0.2 | 0.1 | 0.2 |
| Infrastructure and Support | 0.3 | 0.1 | 0.1 | 0.4 |
| Total | $ 1.7 | $ 0.8 | $ 0.5 | $ 1.0 |
| Major Capital Projects | Approximate ROI |
|---|---|
| Network Rationalization (Facilities & Equipment Consolidations) | >50% |
| Product Visibility/Scanning & Tracking | >20% |
| Facilities Optimization (Consolidating Delivery Operations) | >30% |
| Self-Service Retail Equipment Expansion (Kiosks in Post Offices) | >50% |
| Retail Systems Software (Replace 15-Year Old POS) | >40% |
|
Facility Repairs & Alterations IT Improvements & IT Infrastructure Handheld Data Acquisition (Real-Time Scanning) |
Sustaining Infrastructure and Competitive Investments |
No Retiree Health Benefits Pre-Funding included ($11.1B in 2012 and $5.6B in 2013)
No Legislative Benefits (5-Day Delivery, FERS Refund, RHB Restructuring)
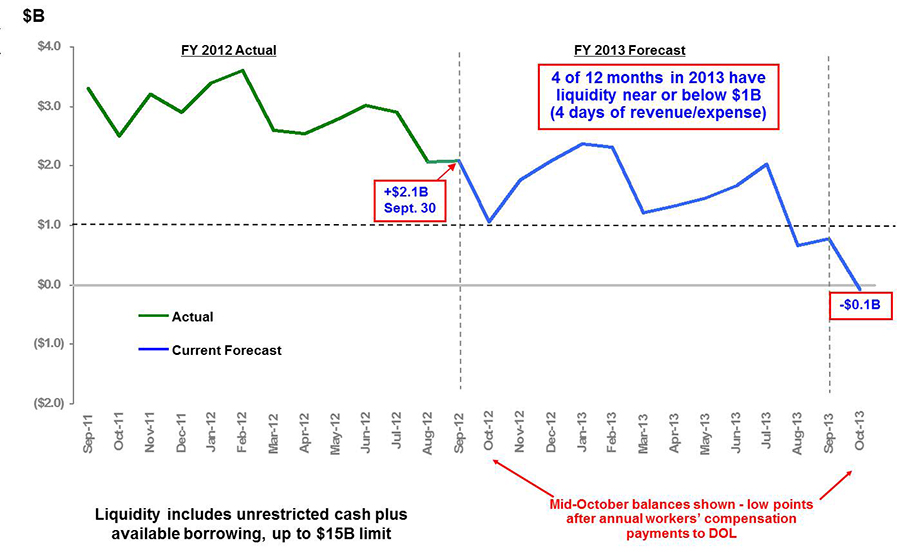
4 of 12 months in 2013 have liquidity near or below $1B (4 days of revenue/expense)
Mid-October balances shown - low points after annual workers compensation payments to DOL
Liquidity includes unrestricted cash plus available borrowing, up to $15B limit
| Reimbursements to cover (millions): | FY 2010 Approved |
FY 2013 OMB Proposal |
FY 2014 USPS Request |
|---|---|---|---|
| Free Mail for the Blind | $68.2 | $69.5 | $66.5 |
| Overseas Voting | 1.3 | 1.3 | 0.8 |
| Reconciliation Adjustments (prior years) | 8.7 | 18.3 | -1.0 |
| Total Reimbursements: Free Mail for Blind & Overseas Voting | 78.2 | 89.1 | 66.3 |
| Revenue Forgone 1993 Act Installments due* | 0.0 | 0.0 | 104.2 |
| Total Reimbursement Request | $78.3 | $89.1 | $170.5 |
| * 2014 Includes $17.2M balance not paid from 2011 and $29M per year for 2012 through 2014 | |||
FY 2014 request is based on an estimated FY 2014 volume of 54.6 million pieces. FY 2014 includes the latest estimates for cost per piece which have been reduced from prior year estimates. OMB uses their own internal model for determining the appropriation request. The model is based upon a multi-year rolling average.
FY 2014 Absentee Ballots are lower than FY 2013 as it is not a presidential election year.
This is a requested reconciliation adjustment due to a difference between the FY 2011 appropriation and the costs of the actual audited volumes.
$29m due USPS for FY 2014 as per the Revenue Foregone Act of 1993.
$29m due USPS for FY 2013 as per the Revenue Foregone Act of 1993.
$29m due USPS for FY 2012 as per the Revenue Foregone Act of 1993.
$17.2m due USPS for FY 2011 as per the Revenue Foregone Act of 1993.
USPS received partial payment of $11.8 million for FY 2011.
NOTE: Our Appropriations for FY 2013 are currently based on a September 22, 2012 Continuing Resolution (CR) which temporarily funds FY 2013 based upon the FY 2012 Appropriations. The CR only goes thru March 27, 2013. Once this CR expires, another one will have to pass or Congress will have to enact individual appropriation bills.
FY 2014 Congressional Reimbursement (Appropriations Request)
Open Session November 2012
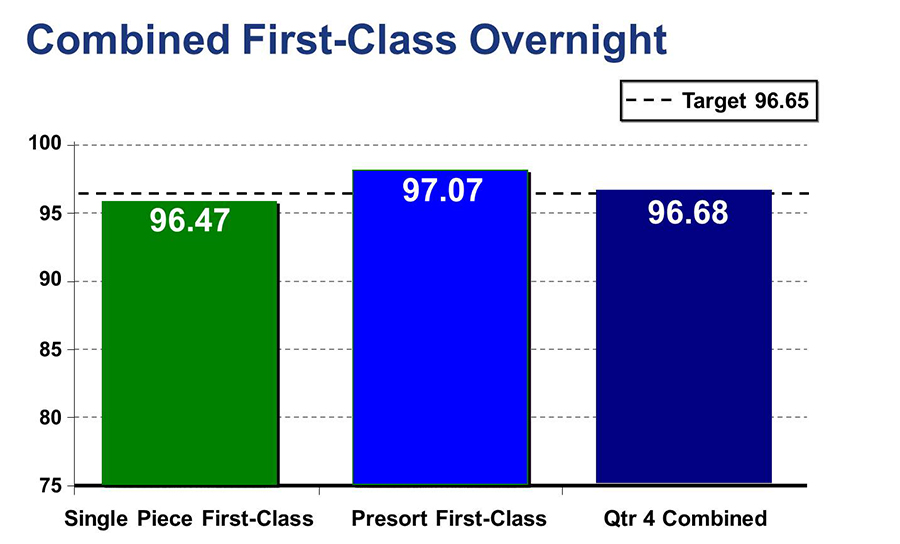
Target 96.65
Single Piece First-Class = 96.47
Presort First-Class = 97.07
Qtr 4 Combined = 96.68
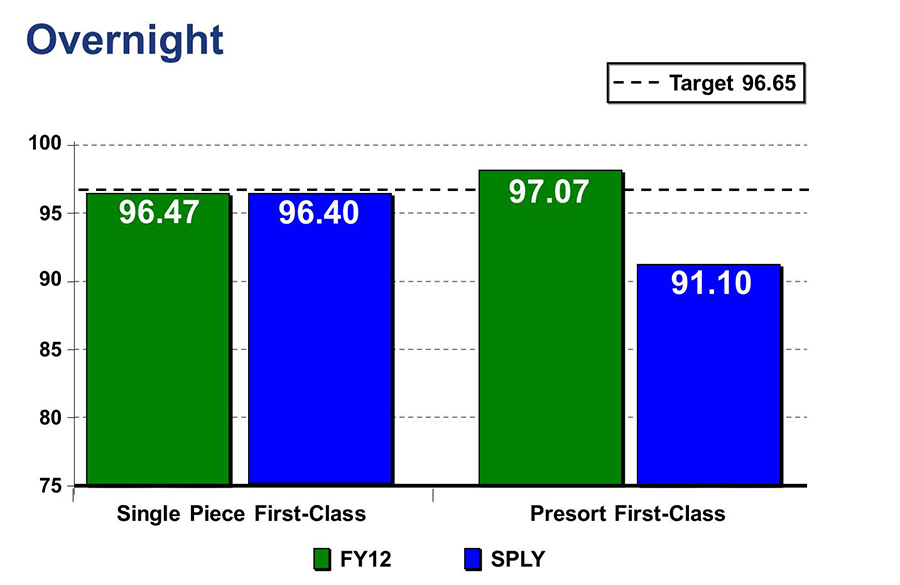
Target 96.65
Single Piece First-Class = FY12 96.47 and SPLY 96.40
Presort First-Class = FY12 97.07 and SPLY 91.10
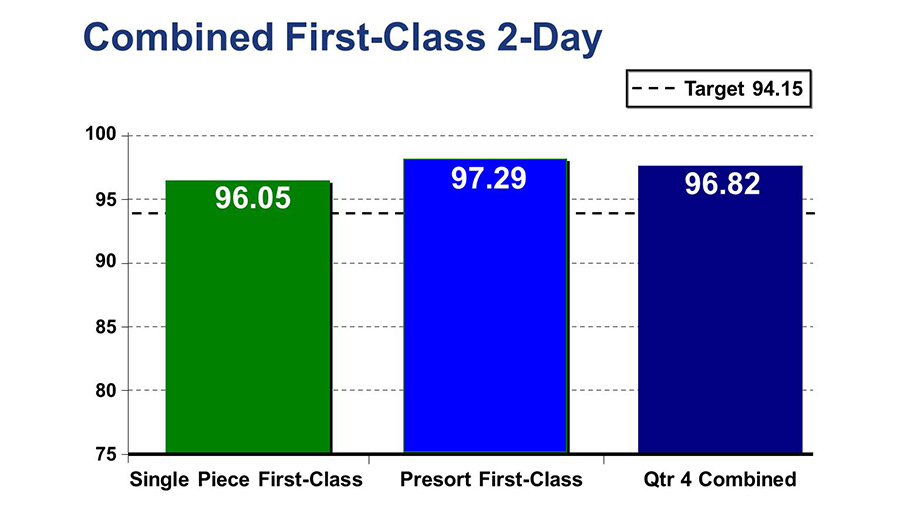
Target 94.15
Single Piece First-Class = 96.05
Presort First-Class = 97.29
Qtr 4 Combined = 96.82
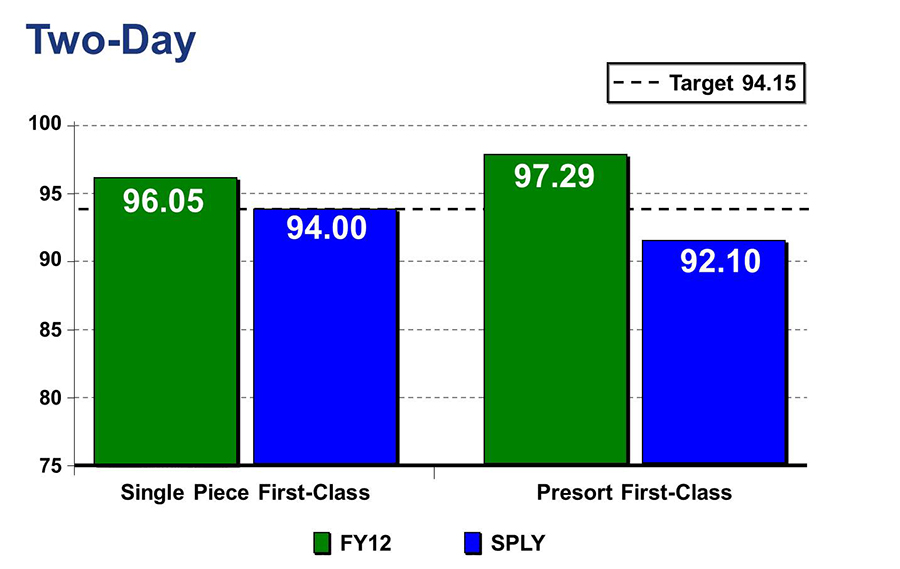
Target 94.15
Single Piece First-Class = FY12 96.05 and SPLY 94.00
Presort First-Class = FY12 97.29 and SPLY 92.10
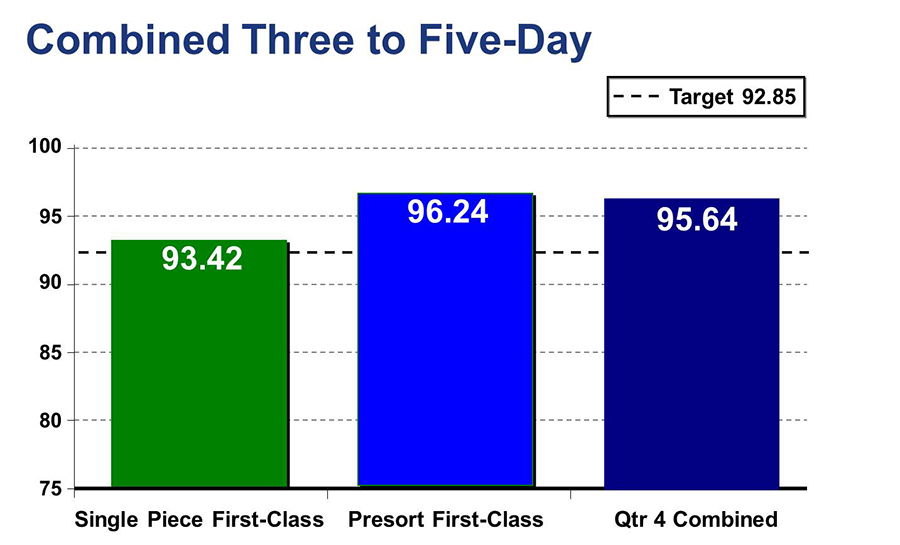
Target 92.85
Single Piece First-Class = 93.42
Presort First-Class = 96.24
Qtr 4 Combined = 95.64
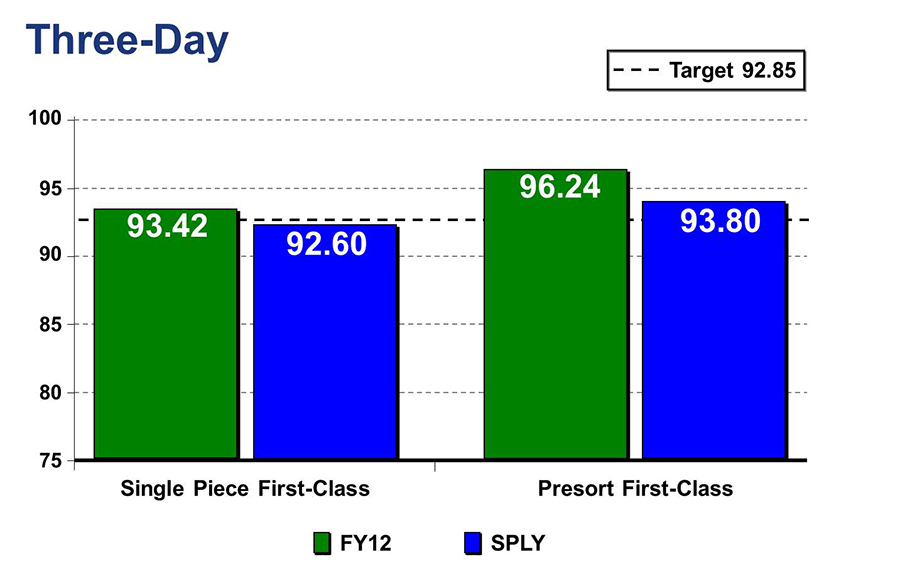
Target 92.85
Single Piece First-Class = FY12 93.42 and SPLY 92.60
Presort First-Class = FY12 96.24 and SPLY 93.80
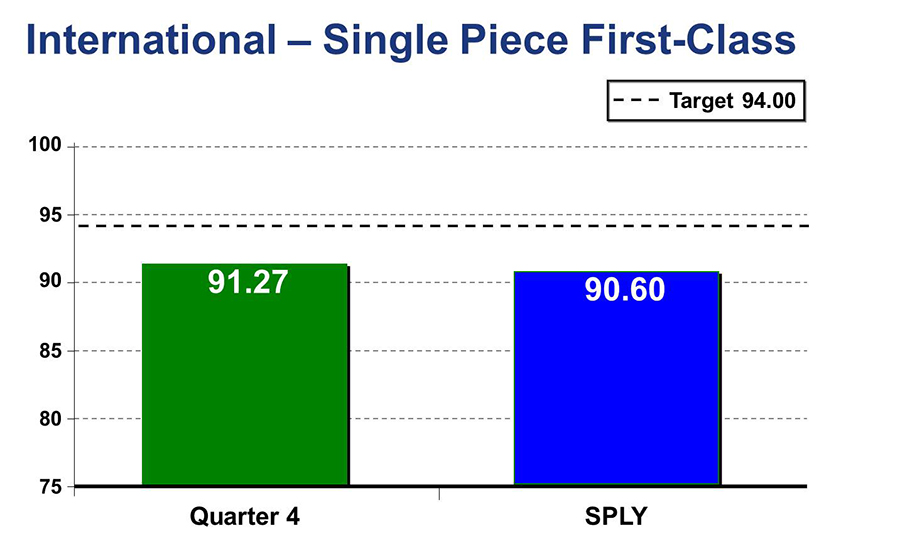
Target 94.00
Quarter 4 = 91.27
SPLY = 90.60
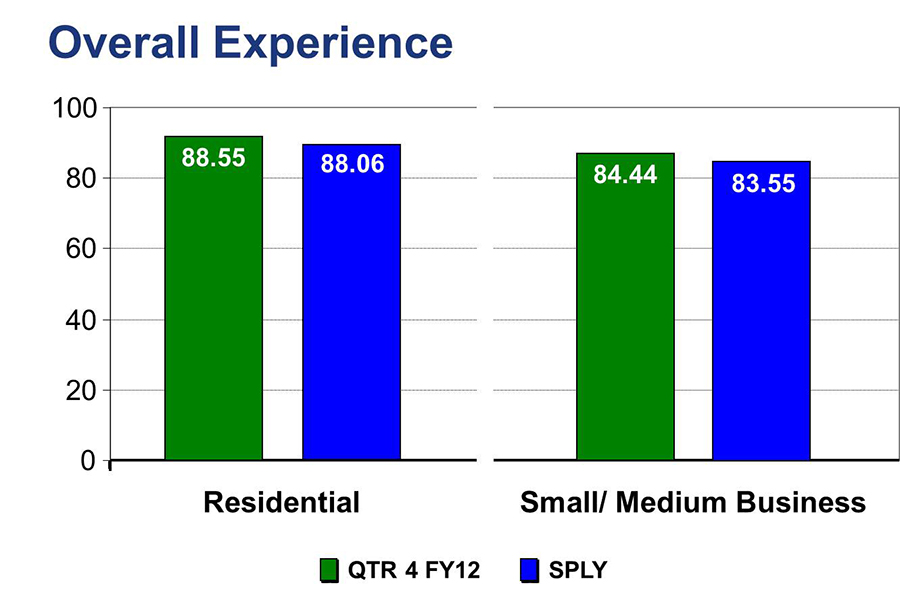
Residential = QTR 4 FY12 88.55 and SPLY 88.06
Small/ Medium Business = QTR 4 FY12 84.44 and SPLY 83.55
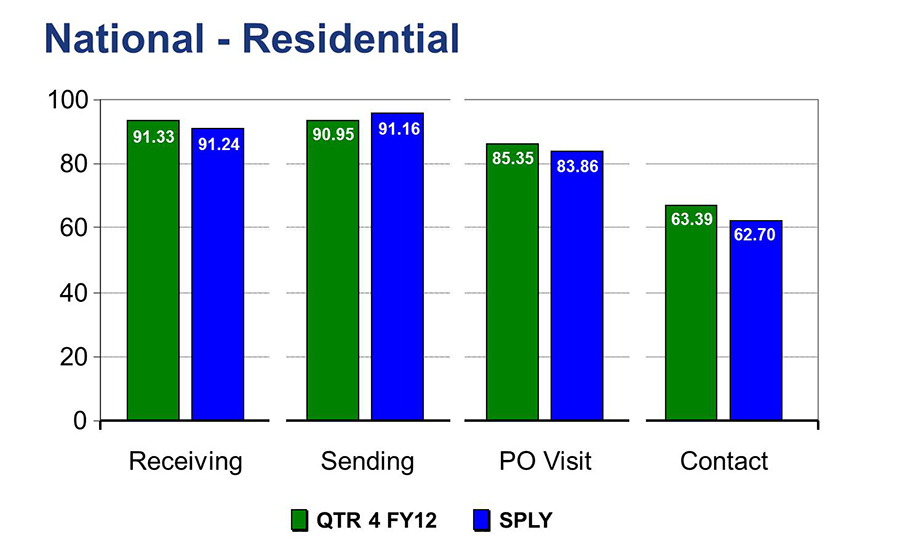
Receiving = QTR 4 FY12 91.33 and SPLY 91.24
Sending = QTR 4 FY12 90.95 and SPLY 91.16
PO Visit = QTR 4 FY12 85.35 and SPLY 83.86
Contact = QTR 4 FY12 63.39 and SPLY 62.70
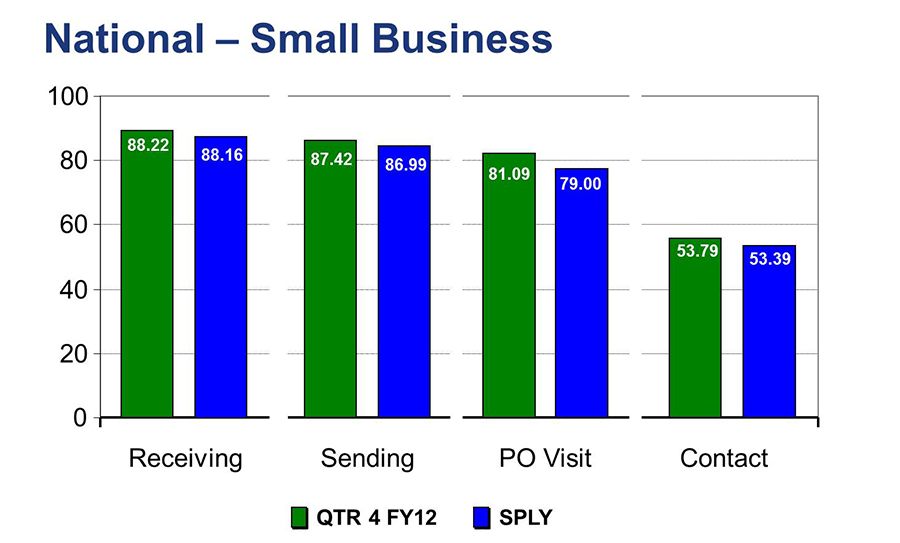
Receiving = QTR 4 FY12 88.22 and SPLY 88.16
Sending = QTR 4 FY12 87.42 and SPLY 86.99
PO Visit = QTR 4 FY12 81.09 and SPLY 79.00
Contact = QTR 4 FY12 53.79 and SPLY 53.39