Financial Results
Quarter II of Fiscal Year 2012
May 10, 2012
Joe Corbett
Chief Financial Officer & Executive Vice President
Download the PDF version
Key Highlights
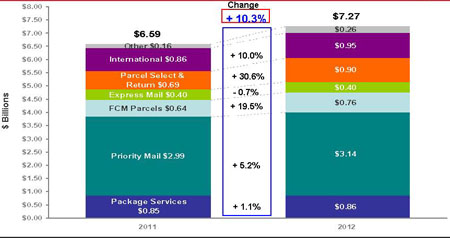
- Shipping Services & Packages (~20% of total revenue):
- Exceptional Revenue Growth (double-digit)
- First-Class and Standard Mail (~70% of total revenue):
- Efficiency Improvements continue to generate savings
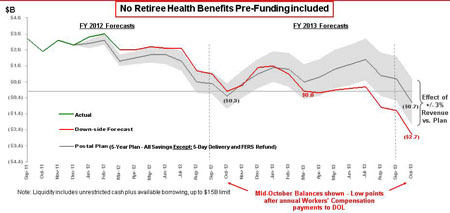
- Unsustainable cost of Pre-Funding Retiree Health Benefits
- Over $6 Billion of expense in first six-months of 2012 for two payments due this year
- Net Loss for Second Quarter was $3.2B ($2.2B in 2011 for Qtr.)
- Net Loss for First Six-Months was $6.5B ($2.6B in 2011 for 6 mos.)
- Legislative Changes are urgently needed
- Senate Bill (April 25) – provides short-term relief, but does not provide for long-term financial viability
Financial Results:
Quarter II (Jan – Mar)
| Quarter II YTD (3 Months) (Billions) |
FY 2012 |
FY 2011 |
| Revenue |
$16.2 |
$16.2 |
| Expenses |
16.7 |
16.7 |
| Operating Income (Loss)* |
(0.5) |
(0.5) |
| Retiree Heath Bfts. Pre-Funding |
(3.0) |
(1.4) |
| Workers' Comp: Fair Value Adjmt |
0.6 |
0.2 |
| Workers' Comp: Claims & Adjmts |
(0.3) |
(0.5) |
| Net Income (Loss) |
($3.2) |
($2.2) |
| Volume (pieces) |
39.5 |
41.2 |
*Before RHBPre-Funding & Non-Cash Adjustments to Workers' Compensation Liabilities
Financial Results:
March Year to Date
| Quarter II YTD (6 Months) (Billions) |
FY 2012 |
FY 2011 |
| Revenue |
$33.9 |
$34.1 |
| Expenses |
34.1 |
34.2 |
| Operating Income (Loss)* |
(0.2) |
(0.1) |
| Retiree Heath Bfts. Pre-Funding |
(6.1) |
(2.8) |
| Workers' Comp: Fair Value Adj |
0.5 |
1.0 |
| Workers' Comp: Other Non Cash Adj |
(0.7) |
(0.7) |
| Net Income (Loss) |
($6.5) |
($2.6) |
| Volume (pieces) |
83.2 |
87.7 |
*Before RHBPre-Funding & Non-Cash Adjustments to Workers' Compensation Liabilities
Total Revenue:
March YTD 2012 and 2011
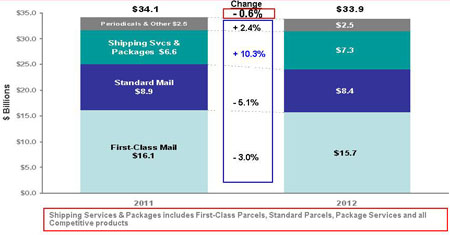
Revenue: March YTD 2012 and 2011
Shipping Services and Packages
Financial Results:
March Year to Date
| Quarter II YTD (6 Months) (Billions) |
FY 2012 |
FY 2011 |
| Revenue |
$33.9 |
$34.1 |
| Expenses |
34.1 |
34.2 |
| Operating Income (Loss)* |
(0.2) |
(0.1) |
| Retiree Heath Bfts. Pre-Funding |
(6.1) |
(2.8) |
| Workers' Comp: Fair Value Adj |
0.5 |
1.0 |
| Workers' Comp: Other Non Cash Adj |
(0.7) |
(0.7) |
| Net Income (Loss) |
($6.5) |
($2.6) |
| Volume (pieces) |
83.2 |
87.7 |
*Before RHBPre-Funding & Non-Cash Adjustments to Workers' Compensation Liabilities
Expenses:
March Year to Date
| Quarter II YTD (6 Months) (Billions) |
FY 2012 |
FY 2011 |
| Compensation |
$18.4 |
$18.8 |
| Benefits |
7.7 |
7.5 |
| Transportation |
3.4 |
3.2 |
| Depreciaton |
1.1 |
1.2 |
| Supplies & Services |
1.1 |
1.1 |
| Rent, Utilities & Other |
2.4 |
2.4 |
| Operating Expenses |
$ 34.1 |
$ 34.2 |
*Before RHBPre-Funding & Non-Cash Adjustments to Workers' Compensation Liabilities
Financial Results:
March Year to Date
| Quarter II YTD (6 Months) (Billions) |
FY 2012 |
FY 2011 |
| Revenue |
$33.9 |
$34.1 |
| Expenses |
34.1 |
34.2 |
| Operating Income (Loss)* |
(0.2) |
(0.1) |
| Retiree Health Benefits Pre-Funding |
(6.1) |
(2.8) |
| Workers' Comp Fair Value Adj. |
0.5 |
1.0 |
| Workers' Comp. Other Non Cash Adj. |
(0.7) |
(0.7) |
| New Income (Loss) |
($6.5) |
($2.6) |
| Volume (Pieces) |
83.2 |
87.7 |
*Before RHBPre-Funding & Non-Cash Adjustments to Workers' Compensation Liabilities
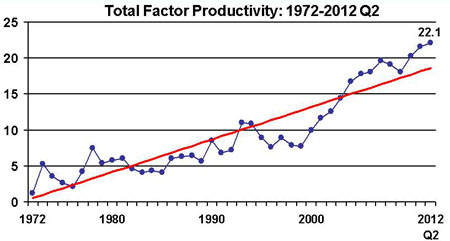
Productivity Continues to Improve
$25 Million Loss Per Day
| 2012 Operating Loss (Before USPS initiatives |
$ (5.4) Billion |
| New improvements: Workhours 7 Revenue |
1.9 |
| Subtotal |
$ (3.5) |
| 2012 RHB Pre-Funding * |
(5.6) |
| 2012 Net Loss, Without Legislation |
$ (9.1) Billion |
| Total Number of Days |
÷ 365 |
| Net Loss per Day |
$ (25) Million |
*Reflects 2012 pre-funding payment only. Payment due August 1 was originally scheduled for 2011
2012 & 2013 Liquidity
Complete Financial results are in the Form 10-Q:
http://about.usps.com/who-we-are/financials/welcome.htm
Q & A
Additional questions can be emailed to:
Susan.Mcgowan@usps.gov
David.A.Partenheimer@usps.gov