|
Ac-cess n [from Latin accessusto
approach] 1: freedom or ability to obtain or make use
of 2: and the United States Postal Service offers more
access than any other retailer in America — or the world.


Capital cash outlays are the payments we make for such
capital improvements as facilities, automation equipment and information
technology. During the year, when we realized that cash flow from operations
was going to be significantly less than we had expected, we reduced our
capital commitments, and we continued the freeze on new facility commitments
to avoid a major increase in borrowing.
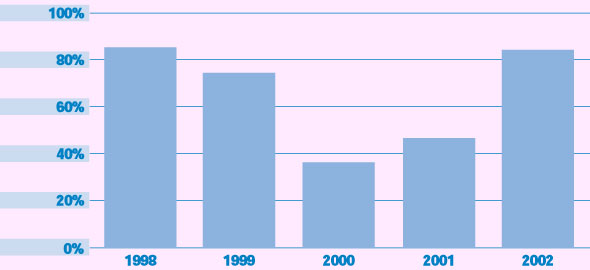
The Cash Flow/Capital Expenditure (CAPEX) ratio shows the relationship
between these main drivers of our debt balance. CAPEX is computed by dividing
cash flow from operations by capital cash outlays. In 2000 and 2001, the
CAPEX ratio was close to 40%, and debt was increased substantially to
cover the gap. In 2002, a $176 million increase in cash flow from operations
and a $1.3 billion reduction in planned capital expenditures raised the
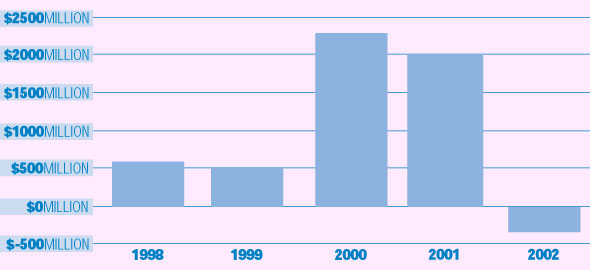
CAPEX ratio to 84%. The remaining gap was covered by reducing non-appropriated
cash on hand. This reduction in available cash not only covered the difference
between cash flow from operations and capital expenditures, but it also
permitted a $200 million reduction in debt as shown in the graph. In other
words, our beginning cash balance of $1.0 billion allowed for reduction
in debt without the use of appropriated funds.
|
|
|