| page 57 of 73 |
Chapter 3
Financial Highlights
| blank | Revenue ($ millions) | Volume (pieces in millions) | ||||||||||
|---|---|---|---|---|---|---|---|---|---|---|---|---|
| blank | 2005 | % of Total | % Change | 2004 | % of Total | 2005 | % of Total | % Change | 2004 | % of Total | ||
| First-Class Mail | 36,062 | 51.5 | (0.9) | 36,377 | 52.7 | 98,071 | 46.3 | 0.1 | 97,926 | 47.5 | ||
| Priority Mail | 4,634 | 6.6 | 4.8 | 4,421 | 6.4 | 887 | 0.4 | 4.6 | 849 | 0.4 | ||
| Express Mail | 872 | 1.2 | 2.3 | 853 | 1.2 | 55 | 0.0 | 2.5 | 54 | 0.0 | ||
| Periodicals | 2,161 | 3.1 | (1.4) | 2,192 | 3.2 | 9,070 | 4.3 | (0.7) | 9,135 | 4.4 | ||
| Standard Mail | 18,953 | 27.1 | 4.6 | 18,123 | 26.3 | 100,942 | 47.7 | 5.6 | 95,564 | 46.4 | ||
| Package Services | 2,201 | 3.1 | (0.3) | 2,207 | 3.2 | 1,166 | 0.6 | 2.9 | 1,132 | 0.6 | ||
| International | 1,765 | 2.5 | 4.1 | 1,696 | 2.5 | 852 | 0.4 | 0.9 | 844 | 0.4 | ||
| Other* | 3,345 | 4.8 | 5.9 | 3,160 | 4.5 | 700 | 0.3 | 16.2 | 602 | 0.3 | ||
| Total | $69,993 | 100.0% | 1.4% | $69,029 | 100.0% | 211,743 | 100.0% | 2.7% | 206,106 | 100.0% | ||
*The Revenue "Other" category includes mailgrams, special services, interest, emergency preparedness appropriations, and free matter for the blind. The Volume "Other" category includes internal Postal Service mail volume, mailgrams, and free matter for the blind.
Note: Percentages are calculated based on unrounded numbers. |
||||||||||||
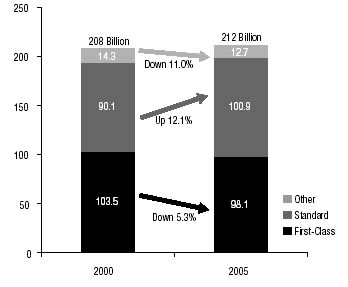
Fig. 3-1 Mail Mix Comparison (pieces in billions)
![]()