

Financial Section Part II
Cash Flow
Cash flows from operating Activities
Net cash used in operating activities was $2.6 billion in 2007 compared to $3.8 billion provided by operating activities in 2006. The year-to-year decrease of $6.4 billion was driven mainly by the $8.4 billion in payments to the PSRHBF in 2007, as required by P.L.109-435, partially offset by the $1.6 billion in CSRS payments that we are no longer required to make. This is also reflected in our 2007 net loss of $5.1 billion compared to 2006 net income of $900 million. Additional cash was provided in 2007 by an increase in other noncurrent liabilities of $275 million primarily contingent liabilities, an increase in compensation and benefits liabilities of $347 million and increased collections of accounts receivable of $80 million. These cash flow increases were partially offset by decreases in payables and accrued expenses of $73 million, and customer deposit accounts and outstanding money orders of $186 million.
In 2006, net cash provided by operating activities of $3.8 billion was $38 million more than 2005. Increases in cash payments for compensation and transportation expenses were offset by increases to non-cash liabilities such as accrued payroll and leave of $304 million and workers’ compensation of $342 million. Also contributing was $169 million of increased collections in accounts receivable in 2006, increased investment income of $81 million, $55 million of additional money orders outstanding at year-end, and a decrease in the interest expense payment on deferred retirement obligations of $32 million.
cash flows from Investing Activities
Net cash provided by investing activities was $500 million in 2007 compared to $5.5 billion used in 2006. Nearly all of the year-over-year change can be attributed to the almost $3.0 billion that was placed in escrow as restricted cash in 2006, and then was removed from restricted cash when transferred to the new PSRHBF in 2007. Capital cash outlays of $2.7 billion increased slightly from the $2.6 billion in 2006. Proceeds from the sale of property were $39 million in 2007 compared to $114 million in 2006. In 2007, the sale of the James A. Farley Building and several Philadelphia properties resulted in proceeds from building sales of $218 million. Excluding the escrow, net cash flow used in investing activities would have been virtually unchanged at $2.5 billion for both 2007 and 2006, rather than the $500 million and $5.5 billion reported.
Net cash used in investing activities was $5.5 billion in 2006 compared to $2.3 billion in 2005. The increase reflects increased investment for mail processing equipment, retail equipment, and building improvements. The 2006 increase also reflects the placement of $3.0 billion into a restricted cash account (mentioned above) as required by P.L.108-18.
cash flows from Financing Activities
Net cash provided by financing activities was $2.0 billion and $2.0 billion for 2007 and 2006, respectively. Our borrowing from the Federal Financing Bank increased $2.1 billion in both years.
In 2006 after funding our escrow requirements for P.L.108-18, we borrowed $2.1 billion to fund capital investments and provide operating cash for future operations.
Financing Activities
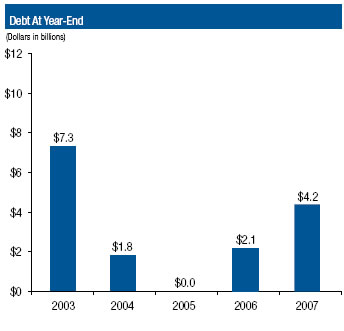
Debt
As an “independent establishment of the executive branch of the Government of the United States,” we receive no tax dollars for ongoing operations. We are self-supporting, and have not received an appropriation for operational costs since 1982. We fund our operations chiefly through cash generated from operations. However, unlike companies in the private sector, we are not permitted to raise capital through the equity markets. Historically our only long-term source of outside capital is through borrowing from the Federal Financing Bank. Under the provisions of P.L.109-435, however, the Postal Service has the statutory authority to earn profits and retain earnings.
The amount we borrow is largely determined by the difference between our cash flow from operations and our capital cash outlays. Our capital cash outlays consist of the funds invested back into the business for new facilities, new automation equipment and new services. Throughout most of 2007 and 2006, we were debt-free, borrowing only to meet year-end cash disbursement requirements. On September 30, 2007, we had $4.2 billion in debt outstanding, a $2.1 billion increase from last year.
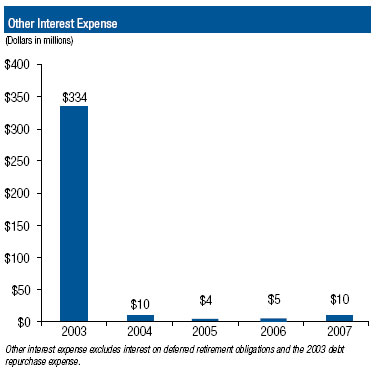
INTEREST EXPENSE
Our debt since 2004 has consisted of short-term debt obligations, which provided us with the flexibility to repay debt with available cash on a daily basis. A major benefit of the short-term obligations was the reduction in interest expense payable to the Federal Financing Bank. As a result, our interest expense on borrowings has been at the lowest levels since the early 1970’s.
INTEREST AND INVESTMENT INCOME
When we determine that our available funds exceed our current needs, we invest those funds with the U.S. Treasury’s Bureau of Public Debt in overnight securities issued by the U.S. Treasury. With marginal debt to repay, and increased cash on hand during recent years, we earned investment income of $169 million in 2007, $140 million in 2006, and $60 million in 2005.
We also recognize imputed interest on the funds owed to us under the Revenue Forgone Act of 1993. Under the Act, Congress agreed to reimburse us $29 million annually through 2035. See Note 12, Revenue forgone, in the Notes to the Financial Statements for additional information.
| Interest and Investment Income | 2007 | 2006 | 2005 |
| (Dollars in millions) | |||
| Investment Income | $ 169 | $ 140 | $ 60 |
| Imputed interest on accounts receivable from the U.S.government | 25 | 25 | 25 |
| Other Interest | 1 | 2 | 1 |
| Total | $ 195 | $ 167 | $ 86 |