

Compensation and Benefits Expenses |
2008 |
2007 |
2006 |
|---|---|---|---|
(Dollars in millions) |
|||
Compensation |
$ 40,633 |
$ 41,695 |
$ 40,577 |
Retirement |
5,899 |
5,737 |
7,006 |
Health Benefits |
5,376 |
5,401 |
5,345 |
Workers’ Compensation |
1,227 |
880 |
1,279 |
Other |
450 |
473 |
458 |
Total |
$ 53,585 |
$ 54,186 |
$ 54,665 |
In 2007, personnel compensation and benefits costs of $54,186 million were $479 million, or 0.9%, less than 2006. The decrease was due to elimination of the employer’s share of the CSRS contribution resulting from the enactment of the new law and reductions in workhours, complement, and workers’ compensation costs.
Although total compensation and benefits were lower in 2007, our labor costs increased by $1,118 million, or 2.8%. COLA increases in 2007 added $871 million to our compensation expenses. These increases were offset somewhat by a decrease of 36 million labor hours. Our 2007 average hourly labor cost increased by 1.6%, compared to an increase of 4.5% in 2006. In 2007, workers’ compensation decreased by $399 million. See Workers’ Compensation later in this section and Note 11, Workers’ compensation, in Notes to the Financial Statements for additional information.
Workhours
In addition to labor and benefits rates, workhours are a major driver of our compensation and benefits expense. In 2008, mail processing, customer service, city delivery, and other workhours decreased by 50 million compared to 2007 offsetting the higher labor rates. The reduction in workhours was in part an outcome of lower mail volumes, which reduced workload. As mail volume fell throughout the year, management initiated a number of efforts to reduce workhours, especially overtime.
Workhours by Function |
2008 |
2007 |
2006 |
|---|---|---|---|
(Workhours in thousands) |
|||
City Delivery |
452,288 |
462,040 |
468,918 |
Mail Processing |
293,108 |
315,825 |
332,269 |
Customer Services & Retail |
217,236 |
233,791 |
246,538 |
Rural Delivery |
189,950 |
189,709 |
186,164 |
Other, including Plant, Operational Support, and Administrative |
220,772 |
221,636 |
224,840 |
Total Workhours |
1,373,354 |
1,423,001 |
1,458,729 |
Rural delivery increased 0.2 million workhours in 2008. The rural delivery workhour growth was driven by the addition of almost 710,000 new rural delivery points.
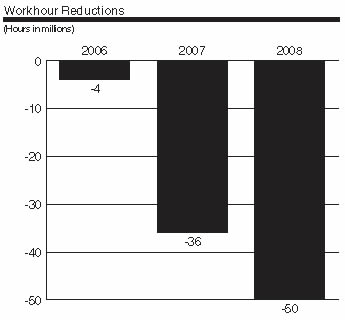
In 2007, total workhours decreased by 36 million hours compared to 2006, partially offsetting the higher labor rates. Mail processing, customer service, and city delivery workhours decreased 36 million hours.
Rural delivery increased 3.5 million workhours in 2007. The rural delivery workhour growth was driven by the addition of more than one million new rural delivery points. Other workhours decreased by three million compared to 2006.
Workhours have been reduced in eight of the last nine years with only 2005 showing a slight increase. Since 2002, workhour reductions have been the single biggest contributor to the ongoing achievement of our savings targets.