

Management’s Discussion and Analysis of
Financial Condition and Results of Operations
Aggregate workload for FY 2008 declined 3.0%. This was mainly due to a sharp decline in weighted mail volume, driven by the 8.5% decline in First-Class single-piece mail volume. In response to the workload decrease, we reduced resource usage 2.4% compared to last year. Labor usage, in particular, fell 3.6% compared to 2007.
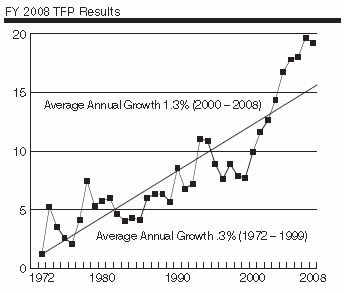
The following graph shows the cumulative TFP trend from 1972 through 2008.
Service And Performance
Management monitors several key statistics to determine performance against our service standards. The major indicators we monitor are the External First-Class (EXFC) on-time mail delivery scores and the Customer Satisfaction Measurement (CSM) scores.
EXFC is an independently administered system that provides an external measure of delivery performance from collection box to mailbox. Although not a system-wide measurement of all First-Class Mail performance, EXFC continuously tests a panel of 463 3-digit ZIP Code areas selected on the basis of geographic area and volume density, thereby providing a measure of service performance from the customer’s point of view. Results of these measures for the last four quarters are listed below.
EXFC Service Performance Scores |
||||
|
Quarter 1 |
Quarter 2 |
Quarter 3 |
Quarter 4 |
|---|---|---|---|---|
(Percentage delivered on time) |
||||
Overnight Delivery |
96 |
96 |
97 |
97 |
2-Day Delivery |
93 |
94 |
95 |
94 |
3-Day Delivery |
88 |
92 |
94 |
93 |
As required by P.L. 109-435, we worked with the PRC to create a set of modern service standards for our Mailing Services products. These standards were issued on December 19, 2007, and will be reflected in the service performance measurements published in 2009. The 2008 service scores do not reflect the new service standards.
CSM is an independently-administered survey of customer opinions about key areas of service to residential customers. The following table displays the residential satisfaction results for the last four quarters.
Customer Satisfaction Measurement |
||||
|
Quarter 1 |
Quarter 2 |
Quarter 3 |
Quarter 4 |
|---|---|---|---|---|
(Percentage) |
||||
Service rated excellent, very |
92 |
92 |
92 |
93 |
CAPITAL RESOURCES AND LIQUIDITY
Capital Investments
At the beginning of 2008, there were 30 Board-approved projects in progress, representing $6.8 billion in approved capital funding. During the year, the Board approved 11 new projects, which totaled $0.9 billion in additional capital funding. A total of 14 projects representing $1.8 billion in approved capital funding were completed. The year ended with 27 open projects that amount to $5.9 billion in approved capital.
While the funding for a project is authorized in one year, the commitment or contract to purchase or build may take place over several years. By year-end, approximately $5.0 billion had been committed to these 27 open projects. Actual capital cash outlays will occur over several years. Through the end of 2008, approximately $3.4 billion has been paid for the 27 projects.