|
page 26 of 55 |  |
financial review
Part II
|
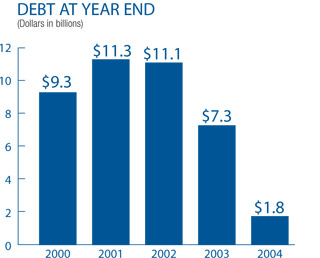
Finance DEBT Unlike other federal agencies, we receive no tax dollars for our operations. We are self-supporting, and have not received a public service appropriation since 1982. The last year that we received any substantial contribution of capital from the U.S. government was 1977, when we received $500 million that we were required to use to repay operating debt. Like any private sector organization, we fund our operations mostly from cash generated from operating revenue. However, unlike our private sector counterparts, we cannot raise capital through the equity markets, and because we are expected to break even over time, we are not expected to accumulate a substantial amount of retained earnings for extended periods to increase our capital. Consequently, our only source of outside capital is through issuing debt obligations. An additional challenge is that unlike the private sector we are not free to set our own prices for our products and services. For us, the rate setting process, which by law we must rely upon, is a complex and lengthy process that can take eighteen months to complete. As a result, we cannot easily adjust our revenue stream to react to changing market conditions. The amount we borrow is largely determined by the difference between our cash flow from operations and our capital cash outlays. Our capital cash outlays are the funds we invest back into the business for our capital investments in new facilities, new automation equipment and new services. From 1997 through 2002, our outlays for capital investment exceeded cash from operations by $5.4 billion, so we covered most of the difference with borrowed funds. From the end of 1997 to the end of 2002, our debt outstanding with the Department of the Treasury's Federal Financing Bank increased from $5.9 billion to $11.1 billion. In 2003 we reduced our debt by $3.8 billion to $7.3 billion and in 2004 by $5.5 billion to $1.8 billion, our lowest level of debt since 1984.
|
The enactment of P. L.108-18 in 2003 dramatically increased our cash flow by $6.2 billion over two years. However, under this law, we are required to apply the savings attributable to the law to debt reduction in those two years. The required debt reduction amounted to $3.5 billion in 2003 and an additional $2.7 billion in 2004.
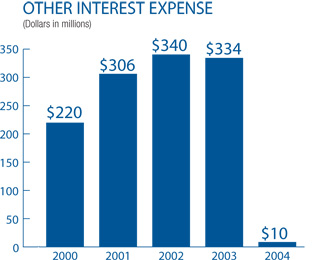
In 2003, we completely overhauled our debt portfolio, paying off all of our long-term debt obligations and replacing most of them with short-term debt that would be available for retirement during the course of 2004. As a result of the overhaul, we benefited from both lower interest rates on short-term debt and the flexibility to repay debt with available cash on a daily basis. A major benefit was the reduction in our interest expense payable to the Federal Financing Bank. Reflecting this change, other interest expense, net of capitalized interest, was $10 million in 2004, the lowest since 1972, versus $334 million in 2003, and $340 million in 2002. The 2003 debt transactions also provided us with the flexibility to pay off substantially more debt in 2004, $5.5 billion, than the estimated $2.7 billion required by the statute, without concerns for paying a prepayment premium. Finally, because we expect our interest earnings on investments to exceed the interest expense on our debt for 2005, we will benefit from any rise in short term-interest rates. |