| Quarter 1 (Billions) | FY 2012 | FY 2011 |
|---|---|---|
|
|
|
|
Revenue |
$17.7 |
$17.9 |
Expenses |
17.5 |
17.6 |
Operating Income (Loss)* |
0.2 |
0.3 |
Retiree Hlth. Bfts. Pre-Funding** |
(3.1) |
(1.4) |
Workers' Comp. Fair Value Adj. |
(0.1) |
0.9 |
Workers' Comp. Claims & Adj. |
(0.3) |
(0.1) |
Net Income (Loss) |
($3.3) |
($0.3) |
Volume (pieces) |
43.7 |
46.5 |
* Before RHB Pre-Funding & Non-Cash Adjustments to Workers’ Compensation Liabilities.
** RHB Pre-Funding: IFP expensing $11.1B in 2012 evenly over 12 mos ($925M / month). Actual results based on $5.5B old 2011 payment) being expensed over 10 mos to revised due date of Aug 1 and $5.6B (2012 payment) being expensed over 12 mos to due date of Sep 30.
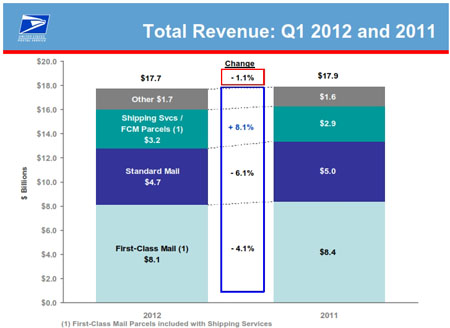
For the first quarter of FY 2012, operating revenue was $17.7 billion, compared to $17.9 billion for the first quarter of FY 2011, a decrease of $200 million, or 1.1%.
The continued success we are having on the Shipping Services side of our business is proof that we know how to be profitable. This is an area where we do have more freedom to react to changes in the marketplace. In the first quarter we saw more than 8 percent increase in revenue and a nearly 10 percent increase in volume compared to the same period last year. Our marketing efforts, including our very successful advertising campaign for our Priority Mail flat rate products, contributed to that growth as did strong growth in online merchandise sales during the holiday period.
However, revenue from Shipping Services represents about 18 percent of our total revenue. Revenue from our most profitable product, First-Class Mail, continues to decline as customers move to electronic alternatives. First-Class Mail revenue has declined nearly 15 percent and volume has declined 25 percent since volume peaked in 2006. Growth in Shipping Services cannot fully offset the decline in First-Class Mail revenue.
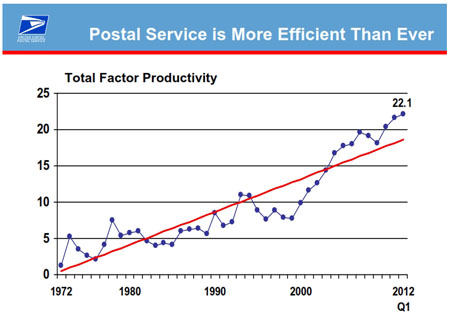
During the first quarter of fiscal year 2012 we reached an all-time high level of productivity as independently measured using Total Factor Productivity methods.
Productivity gains are a result of effective workforce management, efficient use of material (supplies and services including transportation), and maximizing the return-on-capital investments (mainly automation).
Oxford consulting group, named the US Postal Service the number one Post in the World, and pointed out that we were 100% more efficient than the world’s second rated Post.
During this quarter alone, we reduced workhours by 8 million. In the past five years we have reduced our career headcount by over 140,000---more than any other organization in the world.
| Quarter 1 (Billions) | FY 2012 | FY 2011 |
|---|---|---|
|
|
|
|
Revenue |
$17.7 |
$17.9 |
Expenses |
17.5 |
17.6 |
Operating Income (Loss)* |
0.2 |
0.3 |
Retiree Hlth. Bfts. Pre-Funding** |
(3.1) |
(1.4) |
Workers' Comp. Fair Value Adj. |
(0.1) |
0.9 |
Workers' Comp. Claims & Adj. |
(0.3) |
(0.1) |
Net Income (Loss) |
($3.3) |
($0.3) |
Volume (pieces) |
43.7 |
46.5 |
* Before RHB Pre-Funding & Non-Cash Adjustments to Workers’ Compensation Liabilities.
** RHB Pre-Funding: IFP expensing $11.1B in 2012 evenly over 12 mos ($925M / month). Actual results based on $5.5B old 2011 payment) being expensed over 10 mos to revised due date of Aug 1 and $5.6B (2012 payment) being expensed over 12 mos to due date of Sep 30.
| Quarter 1 (Billions) | FY 2012 | FY 2011 |
|---|---|---|
|
|
|
|
Compensation |
$ 9.6 |
$ 9.7 |
| Benefits | 3.8 | 3.8 |
| Transportation | 1.8 | 1.7 |
| Depreciation | 0.6 | 0.6 |
| Supplies & Services | 0.5 | 0.6 |
Rent, Utilities & Other |
1.2 |
1.2 |
| Operating Expenses * | $ 17.5 | $ 17.6 |
* Before RHB Pre-Funding, Non-Cash Adjustments to Workers’ Compensation Liabilities.
| Quarter 1 (Billions) | FY 2012 | FY 2011 |
|---|---|---|
|
|
|
|
Revenue |
$17.7 |
$17.9 |
Expenses |
17.5 |
17.6 |
Operating Income (Loss)* |
0.2 |
0.3 |
Retiree Hlth. Bfts. Pre-Funding** |
(3.1) |
(1.4) |
Workers' Comp. Fair Value Adj. |
(0.1) |
0.9 |
Workers' Comp. Claims & Adj. |
(0.3) |
(0.1) |
Net Income (Loss) |
($3.3) |
($0.3) |
Volume (pieces) |
43.7 |
46.5 |
* Before RHB Pre-Funding & Non-Cash Adjustments to Workers’ Compensation Liabilities.
** RHB Pre-Funding: IFP expensing $11.1B in 2012 evenly over 12 mos ($925M / month). Actual results based on $5.5B (old 2011 payment) being expensed over 10 mos to revised due date of Aug 1 and $5.6B (2012 payment) being expensed over 12 mos to due date of Sep 30.
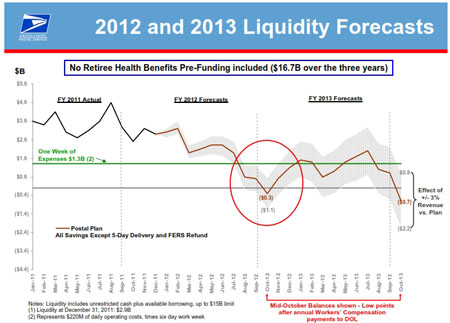
The Postal Service continues to suffer from a severe lack of liquidity caused by over $25 billion of net losses over the past five years including $21 billion of statutory payments for prefunding retiree health benefits. The trend of losses continued into this quarter as the Postal Service had a net loss of $3.3 billion for the three months ended December 31, 2011, and had only $1.0 billion of total cash and $2.1 billion of remaining borrowing capacity on its $15 billion debt facility.
Current projections indicate that the Postal Service will not be able to make the required $5.5 billion prefunding payment for retiree health benefits currently due by August 1, 2012, or the required $5.6 billion prefunding payment for retiree health benefits that is due by September 30, 2012. Additionally, even without the Postal Service making the $11.1 billion of scheduled retiree health benefits payments in the fourth quarter of 2012, current projections indicate that it will have a precariously low level of cash and liquidity at September 30, 2012. This position will continue into mid-October of 2012, when the Postal Service is required to make its annual payment to the Department of Labor (DOL) for workers’ compensation estimated to be approximately $1.3 billion.
The Postal Service continues to update its financial forecasts with special attention paid to short-term liquidity. Emergency measures to preserve cash and liquidity, such as prioritizing employee and supplier payments over government payments, may be available to help ensure continued mail delivery.
To address its financial challenges the Postal Service has developed a plan to reduce its annual operational expenses by $20 billion by 2015. The Postal Service is aggressively pursuing new revenue streams and reducing costs in areas within its control and has proposed legislative changes to Congress that are also needed. Given the vital part that the Postal Service plays in the U.S. economy, the Postal Service is hopeful that Congress will take the steps needed to enact the proposed legislative changes.