The Postal Service Achieved Most Non-financial Goals in 2012
The Postal Service has maintained the same organization-wide strategic goals since the implementation of the Government Performance and Results Act of 1993. These goals balance the interests of customers, policy-makers and employees. The stability of these goals has helped the Postal Service and stakeholders develop a clear understanding of performance over time, and have helped to drive results through consistent focus.
Performance indicators have evolved and measurement systems have been continuously improved. Indicators, measurement systems and results have been subjected to review by the Postal Regulatory Commission, the Office of the Inspector General and the Government Accountability Office. The measurement systems are reliable and verifiable.
The Postal Service has developed detailed performance management systems with information made widely available for planning, decision-making and review. The focus has been to make information timely, relevant and actionable. Performance is rigorously reviewed at all levels of the organization.
Organization-Wide Goals, Measures, Results and Targets
| Goal | Measure | FY 2008 |
FY 2009 |
FY 2010 |
FY 2011 |
FY 2012 |
FY 2012 |
FY 2013 |
|---|---|---|---|---|---|---|---|---|
| Service | Single-Piece First-Class Mail | |||||||
| Overnight | 96.5% | 96.2% | 96.36% | 96.23% | 96.65% | 96.48% | 96.70% | |
| Two Day | 94.1% | 93.7% | 93.71% | 93.34% | 94.15% | 94.84% | 95.10% | |
| Three Day | 92.7% | 92.2% | 92.44% | 91.87% | 92.85% | 92.29% | 95.00% | |
Customer Experience |
Residential |
N/A |
N/A |
86.44% |
87.17% |
2 |
88.36% |
2 |
Small/Medium Business |
N/A |
N/A |
81.83% |
82.95% |
2 |
84.07% |
2 |
|
Financial |
Operating Loss ($ bill.)3 |
N/A |
N/A |
N/A |
(2.7) |
(3.0) |
(2.4) |
(2.0) |
Deliveries per Work Hour |
N/A |
N/A |
N/A |
39.9 |
42.2 |
41.0 |
42.9 |
|
Workplace |
OSHA Illness and Injury Rate4 |
5.74 |
5.62 |
5.49 |
5.67 |
5.72 |
5.44 |
1% below |
Voice of the Employee Survey |
63.7 |
64.05 |
62.36 |
64.7 |
64.9 |
64.7 |
TBD |
|
1 Comparable overall customer experience scores are not available for FY 2008 and FY 2009 due to redesign of measurement survey for FY 2010.
2 Plan/targets are not set as actual survey response percentages; internally as part of the National Performance Assessment they are computed as an index of survey questions (see page 39).
3 Excludes expense impact of Workers' Compensation discount rate changes and actuarial revaluations and Postal Service Retiree Health Benefit Fund.
4 Injury and illness rate is calculated using an industry-wide formula recommended by OSHA: "Total number of OSHA injuries and illnesses (multiplied) by 200,000 hours (divided) by the number of exposure hours worked by all employees. The 200,000 hours represents 100 employees working 2,000 hours per year. It provides the standard base for calculating incidence rates."
5 64.0 is the actual score for the 2009 survey. 63.6 is the baseline index score established for the new VOE survey index used in 2010.
6 62.3 is the actual score for the 2010 survey. 64.5 is the baseline index score established for the new VOE survey index used in 2011.
Despite significant financial pressure and operational changes, national service performance improved to record levels across most service categories.
Service Performance Metrics and Measurement Systems
Single-Piece First-Class Mail is one of the most widely used mail categories and is familiar to consumers, small organizations and larger commercial firms. It uses virtually all elements of the Postal Service operating chain, from collection boxes and retail counters to final delivery.
It has been traditionally used to represent service, especially since customers use it and expect bills, statements, payments, business communication and personal correspondence to arrive on time.
Single-Piece First-Class Mail
Since 1990, the Postal Service has contracted with an outside entity to measure First-Class Mail service performance independently and objectively via the External First-Class Mail® measurement system (EXFC).
EXFC is a rigorous external sampling system measuring the time it takes from deposit of mail in a collection box or lobby chute until its delivery to a home or business. EXFC measures the transit time for single-piece rate First-Class Mail cards, letters and flat envelopes, and compares this actual service against service standards.
EXFC continuously tests service in 892 three-digit ZIP Code areas between which virtually all Single-Piece First-Class Mail originates and destinates.
Service performance for Single-Piece First-Class Mail parcels has now been combined with EXFC performance to formulate these combined Single-Piece First-Class Mail results. Single-Piece First-Class Mail parcel service is measured using an internal USPS system.
This system measures transit time from the time of mailing at a Post Office until the time of delivery for parcels for which a customer requested Delivery Confirmation service. Actual transit time is then compared against First-Class Mail service standards.
Service performance has steadily improved and reached record levels in FY 2012.
Performance is seasonal and weather may affect year to year comparisons.
The Postal Service Measures Service Performance for All Market Dominant Products
Detailed descriptions of measurement systems and quarterly performance reports are available on the USPS website at http://about.usps.com/what-we-are-doing/service-performance/welcome.htm for:
- Single-Piece First-Class Mail
- Presort First-Class Mail
- Single-Piece First-Class Mail International
- Standard Mail
- Periodicals
- Package Services
- Special Services
Service performance detail is discussed with major mail industry stakeholders at the Mailers Technical Advisory Committee (MTAC) and service issues are addressed by focus groups consisting of relevant mailers and their associations.
New tools based on the continuing adoption by mailers of Full-Service Intelligent Mail barcodes (IMb), such as Service Performance Diagnostics, are becoming available to help the Postal Service and participating customers plan more effectively and promptly respond to service issues.
In addition, the Postal Service maintains an extensive outreach program to customers with a number of channels for customers to raise issues and resolve service problems.
Annual performance detail is provided to the Postal Regulatory Commission (PRC) in the Annual Compliance Report (see http://www.prc.gov/prc-pages/dockets-search/default.aspx and select ACR by year). The FY 2012 ACR will be provided to the PRC by Dec. 28, 2012.
Service Performance Diagnostics
The Service Performance Diagnostic tool was launched in February 2011 and continues to be enhanced to increase efficiencies in mail movement. The tool is part of an overall strategy to reduce work-in-progress at mail processing facilities, reducing service failures and improving on-time performance of all mail classes.
In FY 2012, the Postal Service enhanced its measurement system to view work-in-process. The tool now provides a unique view of commercial mail flows with the ability to monitor work-in-progress from induction through final processing. Data is provisioned to allow the assessment of service impacts down to the specific mailer and mail processing facility.
Pareto impact analysis is used to provide focus on systemic issues impacting service performance. These enhancements, combined with the operational focus on continuous improvement, contributed to significant improvements in service performance.
Customer Experience Measurement
Objective, quantitative measures provide one perspective on Postal performance. Customer opinions are equally valid. Together, the two approaches provide a more complete assessment of performance.
The Postal Service operates, through a third-party, the nation's largest customer experience measurement survey. Approximately 304,102 residential and 325,530 small/medium business customers responded to the surveys in FY 2012 for response rates of 15.2 percent and 8.5 percent respectively. These surveys provide an ongoing assessment of attributes defined by customers as critical to their experiences.
Survey results are publicly reported quarterly at http://about.usps.com/what-we-are-doing/service-performance/welcome.htm. They are designed to provide reliable, actionable data at the district level and below.
For FY 2012, the customer experience scores continued to improve compared to the same period last year. We have made progress in identifying opportunities to improve how we interact with customers.
We identified "contact" experience as a key opportunity for improvement and in FY 2012 launched a Customer Experience Essentials Program intended to engage and provide resources and guidance to all employees who interact with customers.
The program focused on four basic principles — telephone courtesy, friendly and courteous behavior, delivery accuracy and letting customers know that we appreciate their business.
To support the Customer Experience Essentials program, a cross-functional team consisting of headquarters, field, management and labor organizations worked collaboratively on The Delivering a Positive Customer Experience messaging campaign to engage all employees and foster a culture of responsiveness to ensure customers everywhere receive a positive, efficient and friendly experience every day, every time, everywhere.
Financial Performance Metrics and Measurement Systems
Financial information is developed according to generally accepted accounting principles and industry best practices. Internal controls over financial reporting are subject to the requirements of the Sarbanes-Oxley Act (SOX). Financial results are posted quarterly in 10-Q reports and annual audited 10-K reports are also posted. 8-K reports outline significant changes during the year. http://about.usps.com/who-we-are/financials/welcome.htm.
Detailed cost and revenue data is filed with the Postal Regulatory Commission (PRC), and is subject to public inquiry during regulatory proceedings. Financial systems are also subject to review by the USPS Office of Inspector General (OIG) and the Government Accountability Office (GAO).
Operating Income (Loss)
FY 2012 had Total Revenue of $65.2 billion and Total Expenses of $81.0 billion resulting in a Net Loss of $15.9 billion.
However, because the legislative mandates for prefunding of retiree health benefits as well as the legally-mandated participation in the federal workers' compensation program are not subject to management's control, we believe that analyzing operating results without the impact of certain of these charges provides a more meaningful insight into current operations.
Thus, when the impact of the required prefunding payments and expense related to the long-term portion of workers' compensation are excluded, the net operating loss was $2.4 billion.
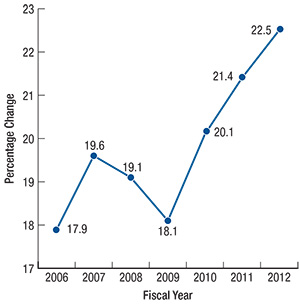
Deliveries per Workhour
Deliveries per workhour summarizes the effectiveness of productivity improvement efforts. The indicator is relevant, especially as the organization manages a declining volume workload with a constantly increasing universal delivery network.
In FY 2012, the total number of pieces declined from 168.3 billion to 159.9 billion, while delivery points grew from 151.5 million to 152.1 million. The Postal Service reduced total workhours by 27 million.
Total Factor Productivity
Although Total Factor Productivity (TFP) is not currently used as a measure of year-over-year performance, it remains a measure of longer-term productivity trends.
Total Factor Productivity declined in 2008 and 2009 as mail volume declined more rapidly than the Postal Service could adjust.
Overall productivity has been increasing since 2010 as network optimization and other programs take effect.
TFP recognizes both mail volume and delivery points and weights the volume of various Postal products to account for variations in work content due to factors such as size, weight, mailer preparation levels and mode of transportation. This allows consistent comparisons among Postal products.
Total Factor Productivity (Cumulative)
Source: Christensen Associates
Workplace and Workforce Metrics and Measurement Systems
Safety data is collected and reported according to standard requirements of the U.S. Occupational Safety and Health Administration (OSHA). Data and systems are subject to review by OSHA, which also may conduct on-site inspections. Safety practices are also subject to review by the Office of the Inspector General (OIG) and the Government Accountability Office (GAO).
Voice of the Employee Survey
The Postal Service measures the engagement of its workforce with the Voice of the Employee (VOE) survey. The VOE survey is a way for employees to confidentially express their opinions about the work environment.
A third-party vendor tabulates the results and reports them back to the Postal Service in summary form. Participation is voluntary and employees can complete the survey on-the-clock. In 2012, more than 299,000 employees voiced their opinions using the VOE survey, making it one of the largest surveys of its kind in the nation.
These key questions are used to create an index to track progress on employee-centered initiatives and assess national trends.
Strategic Direction |
I am aware of current business conditions facing the Postal Service. |
|---|---|
Trust |
I am confident in the ability of senior management to make the decisions necessary to ensure the future success of the Postal Service. |
Contribution to Growth |
Rate the quality of service provided by your office/facility to customers. |
Communication |
Rate your immediate supervisor on communicating regularly to keep you informed. |
Diversity/Respect |
The Postal Service values diversity of backgrounds, talents and perspectives. |
Commitment |
I feel personally responsible for helping the Postal Service succeed as a business. |
Personal Safety |
I receive information to perform my job safely. |
Work Effort and Quality |
I understand how the work I do impacts the service the Postal Service provides. |
Results from the survey show that employees are highly aware of current business conditions and understand the role they play has an impact on service.
Employees are mixed in their feelings about the ability of their work units to adapt to change and many express concerns for the future of the Postal Service.
Nevertheless, employees say they are proud to work for the Postal Service and they feel a personal responsibility to help the organization succeed as a business.
In 2012, the Postal Service attained an index score of 64.7, which is the same as the prior year.