|
U-ni-ver-sal adj [from universum
the universe] 1: comprehensively broad and versatile
without limit or exception 2: combine that with service
and you're talking about the mission of the United States Postal Service
— affordable, universal service for every American.


Our capital plan for the future calls for aggressive cost
management by developing and deploying new automation and mechanization
equipment that will increase our operating efficiency. We estimate our
total capital commitment plan for 2003 at $2.5 billion. We will continue
to concentrate on maintaining such infrastructure as facilities, vehicles
and systems, as well as return on investment projects. Under this plan,
we will make investments in programs that reduce work hours in our distribution,
processing and delivery operations. A prime example of this type of investment
is Postal Automated Redirection System (PARS) approved by the Board of
Governors in 2002. PARS will identify and intercept letters that should
be forwarded during the initial handling and automatically redirect them
to the new address. Each year we process more than 43 million change-of-address
orders and over 5 billion pieces of mail that must be either forwarded,
returned to sender or handled alternatively. The total cost attributed
to this activity exceeds $1.5 billion annually. PARS technology will help
us capture cost savings by reducing labor and the time required for delivery.
With the exception of mail forwarding, there are no new major automated
equipment initiatives left for letter mail. We will focus on flat mail
processing, including the Flats Optical Character Reader, Flats Identification
Code Sorter and the Flats Feeder Enhancement Program. We expect this focus
will be as successful as our efforts in reducing costs for letter mail
processing.
In 2001, our facility-related investments were limited to those that addressed
emergency, safety and legal issues; modifications to ongoing construction;
planning funds for a small number of major projects and opportunities
for revenue generation or significant savings. In 2002, we expanded these
criteria to address high growth areas, facility obsolescence and necessary
maintenance of our real property assets. We review projects meeting these
criteria on a case-by-case basis.

From 1997 through 2001, our capital cash outlays exceeded cash flow from
operations by $5.3 billion, so we covered the difference with borrowed
funds. Our debt outstanding with the Department of the Treasury’s Federal
Financing Bank increased by $5.4 billion during that period. This year,
however, we were able to reverse the trend of increasing debt each year.
Debt outstanding at the end of the year was $11.1 billion, a decrease
of $200 million compared to 2001.
Our debt balance at the end of the year represents our highest level of
debt for the year because, while we accrue our expenses for workers’ compensation
and deferred retirement benefits throughout the year, we make the actual
payments in late September. This year we paid $4.7 billion, including
$787 million for workers’ compensation and $3.9 billion for the Civil
Service Retirement System (CSRS) deferred retirement costs and cost of
living adjustments (COLAs) for retirees. Our cash flow throughout the
year was sufficiently strong to reduce debt from the prior year-end level.
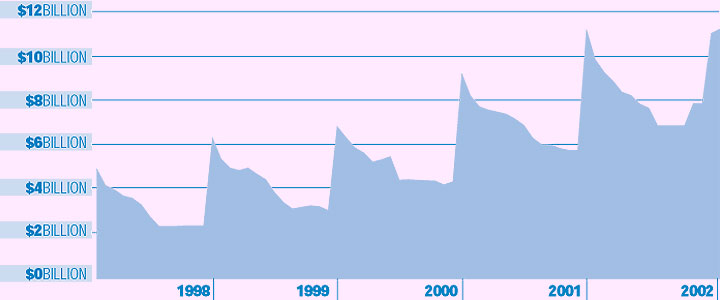
We have debt financing flexibility and can manage the fluctuations in
our debt during the year by actively managing our credit lines. However,
just as our debt balance at year-end has increased in recent years, so
has our average debt level. The graph of our debt during the year illustrates
this point well, showing that the peaks were getting higher each year.
For 2002, our average outstanding debt during the year was less than the
prior year-end balance but increased 20.3%, or $1.3 billion, to $7.7 billion.
Our interest expense totaled $340 million in 2002, compared to $306 million
in 2001. Managing cash and debt on a daily basis is one of the means we
use to minimize annual interest expense.


|
|
|